Article
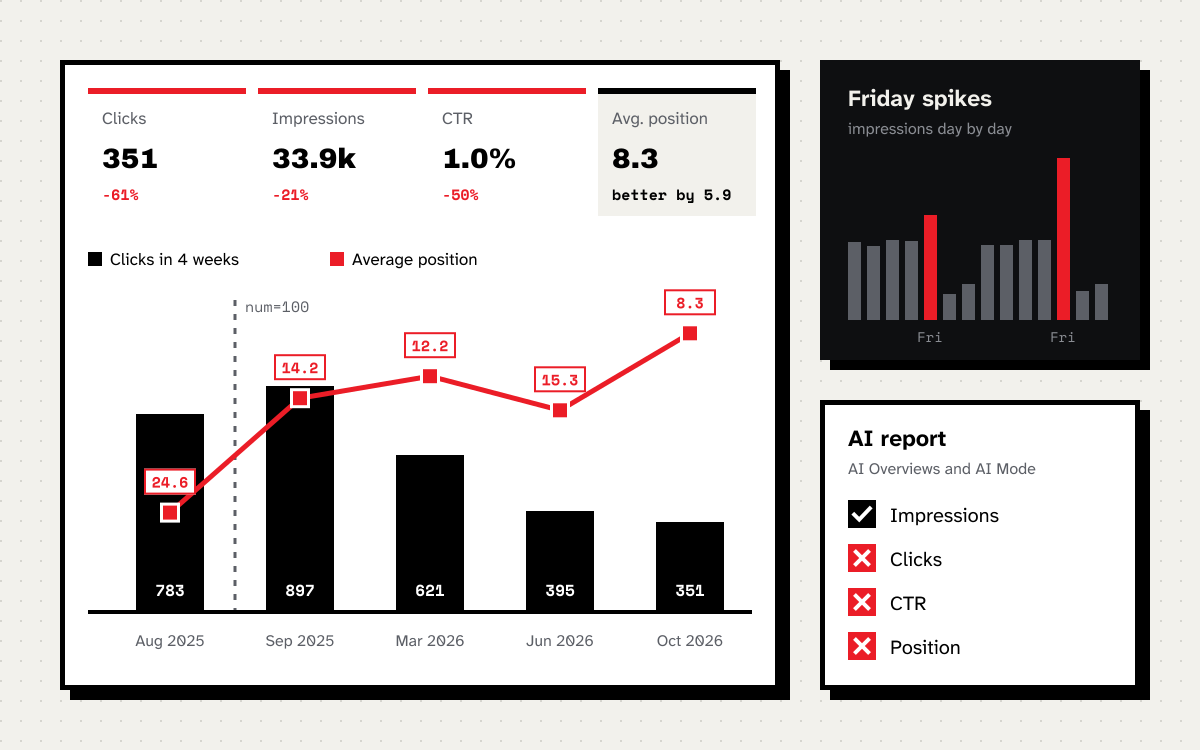
A client opens Search Console and sees good news: average position went from 24 to 8, so the site ranks higher than ever. Then they look at clicks and see less than half of what they had a year ago. Both numbers are real. Only one of them says anything about the business.
I took apart the Search Console data of one B2B site I have access to. It is a service company in the label printing equipment industry, with about one and a half thousand different queries in four weeks. I do not name it, because the data is not mine. The numbers are real, exported on 6 November 2026.
Five periods, one contradiction
I compare four-week periods, always Monday to Sunday, so weekends do not skew the result.
| Period | Clicks | Impressions | CTR | Average position |
|---|---|---|---|---|
| 11 Aug to 7 Sep 2025 | 783 | 51,128 | 1.5% | 24.6 |
| 15 Sep to 12 Oct 2025 | 897 | 43,070 | 2.1% | 14.2 |
| 9 Mar to 5 Apr 2026 | 621 | 43,645 | 1.4% | 12.2 |
| 8 Jun to 5 Jul 2026 | 395 | 46,752 | 0.8% | 15.3 |
| 5 Oct to 1 Nov 2026 | 351 | 33,928 | 1.0% | 8.3 |
I calculated the average position for each period from the desktop, mobile and tablet data, weighted by impressions. It may differ from the dashboard by a few tenths.
Over 15 months the position improved threefold. The last period had 61% fewer clicks than autumn 2025, and 60% fewer than the same calendar weeks a year earlier. Seasonality does not explain it. There are at least three different things in this data, stacked on top of each other.
September 2025: impressions down, position up, clicks intact
Between the first and second period impressions fell by 16%, average position jumped from 24.6 to 14.2, and clicks grew by 15%. If the site had really climbed 10 places, clicks would have multiplied, not grown by 15%.
The device split tells the most:
- desktop: impressions down 21.5%, average position from 27.5 to 16.0,
- mobile: impressions up 3.6%, average position from 14.7 to 9.4.
In the daily data the change falls between 10 and 12 September 2025. That is exactly when Google stopped supporting the &num=100 parameter, which showed a hundred results on one page. It was used mostly by rank tracking tools that pulled the whole top hundred in a single request. Zeo gathered data from many sites: 87.7% of them lost impressions, most of all on desktop. Google did not announce the change, and when asked, said the parameter was not officially supported.
Search Console counts an impression when a link to the site could have been seen, including at position 60 if someone loaded a page with a hundred results. Search Console Help defines average position as the topmost position of the site in results, averaged across all queries where it appeared. When impressions from distant positions disappear, the average improves by itself, even though no page moved.
The practical takeaway: do not compare impressions or average position from before 12 September 2025 with anything after it. You can compare clicks, because bots did not click.
Fridays that break weekly averages
Since May 2026 almost every Friday looks different on this site. There are usually between a third more and twice as many impressions as on Thursday. Clicks do not grow, and are often lower.
An example from October 2026. On Thursday 15 October the site had 803 impressions on desktop and 440 on mobile. On Friday 16 October it was 1,383 and 1,147, with 8 clicks instead of 18. The spike is on both device types, and position barely changes.
This pattern fits an automated tool that checks results once a week, for example rank monitoring scheduled for Fridays. I cannot be sure, because Search Console does not show who searched. What is certain is that these impressions bring no traffic and push CTR down.
What to do about it:
- compare full weeks, not single days,
- if your data shows the same rhythm, check whether someone at the company or the agency has monitoring scheduled for that day,
- calculate CTR from days without spikes, or look at clicks instead of CTR.
2026: position keeps improving, clicks keep falling
This is the most important part. Between autumn 2025 and autumn 2026 average position improved from 14.2 to 8.3, impressions fell by 21% and clicks by 61%. CTR halved, from 2.1% to 1.0%. This time desktop and mobile are hit equally: 62% fewer clicks on desktop, 58% fewer on mobile.
Only the query level shows what is happening.
- The main service query (equipment brand plus “printer repair”). Almost the same impressions, 169 and 165. Position from 7.6 to 10.2. Clicks from 23 to 5, CTR from 13.6% to 3.0%.
- Two navigational queries (equipment brand plus “service”). More impressions, from 105 to 189 combined. Position dropped from around 1.7 to between 3.3 and 4.7. Clicks from 23 to 4.
- How-to queries (printer does not print labels, calibration, blank labels). A year ago the site ranked between 2 and 5 and got clicks. Now some of them sit between 6 and 9 with zero clicks, and some have disappeared from the data.
If the key queries dropped while the site’s average position improved, something else is pulling the average up: small queries at good positions and the absence of impressions from distant pages. At the same time the site is losing top spots in the few queries that brought most of the traffic. The average cannot show this, because each query weighs as much as its impressions, not as much as the money it brings.
For how-to queries there is a second reason. Google increasingly answers questions like “why does my printer print blank labels” itself, in AI Overviews or AI Mode. According to Search Console Help, all links in one AI Overview get the same position, and impressions follow the standard rules. So a page can have a good position and an impression, while the user gets the answer before reaching the link. For this site I do not have data that settles it, so I treat it as a hypothesis to check, not a verdict.
How to check whether AI is taking your clicks
Since June 2026 Search Console has a separate generative AI performance report. Since 31 August 2026 it is available to all sites. According to Google’s help page, it shows how many times links to the site appeared in AI Overviews and AI Mode, broken down by page, country, device and date.
It has three limits worth knowing before drawing conclusions:
- it shows impressions only, with no clicks, CTR, position or queries,
- AI Overviews and AI Mode are combined and cannot be separated,
- the same impressions are already in the regular performance report, under the Web search type, so you must not add them to the total.
Even so, it tells you a lot. Make a list of pages that lost clicks while keeping similar impressions. Then check which of them show up in the AI report. If a how-to page has many AI impressions and its clicks dropped, that is a strong sign users get the answer in the results. Finally, type a few of those queries into Google in a private window and see what the customer sees.
What to measure instead of average position
In client reports I no longer show the site-wide average position as the headline number. Instead I look at:
- Clicks and conversions, ideally year over year, in the same calendar weeks.
- Position and CTR of the dozen or so queries that bring money. For a store these are usually categories and product names, for a service company the service name with a city or a brand. Each one separately, not as an average.
- The desktop and mobile split. Changes in tools and automation show up more often on desktop.
- Query groups: brand, services or categories, how-to content. AI and changes in results affect each group differently.
- Impressions in the AI report for pages that are losing clicks.
- Dates of changes. I mark 12 September 2025 and every major Google update in reports, so nobody compares data from before a change with data after it.
This analysis does not need expensive tools. I use my own connection between Claude and Search Console, which lets me ask questions about the data in plain language and compare periods in seconds. The same can be done with an export to a spreadsheet.
What to do when clicks fall despite a good position
There is no single answer, but these are the things I check first:
- Service and category pages. If the main service query fell from the first page to the bottom half of the results, that is an ordinary SEO problem, not AI. I check who ranks higher, what they have on the page, what is missing on ours and whether the page has lost internal links.
- Navigational queries. Dropping from first to fourth place on a brand name usually means the manufacturer or a large site now ranks higher. What helps then is a page that clearly says whether it is an authorised or an independent service for that brand, with the address and company details.
- How-to content. Content that AI can sum up in three sentences will bring fewer and fewer clicks. What works better is what a summary cannot replace: a calculator, photos of a real case, a downloadable file, a price list, a repair request form. I wrote about preparing a page for AI Overviews in a separate post.
- Visibility in AI answers. If the site has impressions there, it is worth making sure the answer ends with the company name, not just instructions. That is work on content and structured data, which I describe under the GEO service.
In short
- Site-wide average position is a weak metric today. It can rise while traffic falls.
- Do not compare impressions and position from before 12 September 2025 with later data.
- Regular impression spikes on one day of the week are usually automation, not customers.
- Check falling clicks at a good position on single queries, separately for brand, services and how-to content.
- The AI report in Search Console shows impressions only, but that is enough to find the pages AI is taking clicks from.
If the numbers in your Search Console do not add up either, get in touch. I will go through the data and tell you what it means before anyone starts changing the site.